
Turn Data
Into Decisions.
Give leaders and teams clear, trustworthy reporting that shows what is happening, why it matters, and where action is needed. Visus helps organizations design, build, improve, and support business intelligence and reporting solutions with Microsoft Power BI as our primary platform. The goal is not simply to build dashboards. It is to create reporting that people trust, understand, and use to make better decisions.










 Power BI
 Microsoft Fabric
Reporting should help you run the business
Many organizations already have reports and dashboards, yet leadership still struggles to get the answers it needs.
The numbers may be inconsistent. KPIs may not reflect how the business is actually managed. Calculations may be wrong. Reports may be cluttered or difficult to use. Users may export data to Excel because the reports do not give them what they need. Slow reports and overly complex models can make the experience frustrating.
When that happens, the problem is not that the organization lacks reporting. The problem is that the reporting is not doing its job.
Visus helps organizations build reporting around the decisions people need to make. That means understanding the business questions first, then creating the right KPIs, calculations, views, and visualizations to support them.
Effective reporting should help answer questions such as:

The warning signs often
show up in everyday decisions
Your reporting environment may need attention if:
Four capabilities.
One goal: reporting people can trust and use.
See the Health of the Business at a Glance
Leadership needs more than access to data. Executives need a clear view of the metrics that matter most to business performance.
Visus works with leaders and department stakeholders to define the KPIs that actually matter, align the logic behind them, and design dashboards that make performance easy to understand.
- Executive dashboards
- KPI scorecards
- Sales and revenue performance
- Operational performance
- Branch and regional reporting
- Trend and variance analysis
Build New Reports or Fix the Ones You Already Have
Visus develops new Power BI dashboards from the ground up and redesigns existing reports that are cluttered, confusing, or difficult to use.
Good report design is not about fitting as many charts as possible on a page. It is about helping users quickly understand the story in the data.
We organize reporting around the questions users need answered, highlighting trends, exceptions, performance gaps, and opportunities for action.
- New Power BI dashboard development
- Report redesign and usability improvements
- Clearer information hierarchy
- Better navigation and filtering
- More intuitive visual storytelling
- Supporting paginated and print-ready reporting where appropriate
Make Sure the Numbers Are Right and the Reports Perform
A dashboard can look polished and still tell the wrong story.
Visus reviews and corrects calculations, measures, queries, and data models so reporting reflects how the business actually operates.
We also help improve slow reports and simplify overly complex models that make the reporting experience harder to maintain or use.
- Correct calculations, measures, and queries
- Align reporting logic with real business rules
- Simplify overly complex models
- Improve report performance
- Reduce uncertainty around KPI calculations
- Support more dependable reporting over time
Give Each Audience the View It Needs
Executives, managers, branch leaders, and individual contributors do not need the same report.
Visus designs role-based reporting so each audience can see the information relevant to the decisions they make, while still working from a consistent underlying data foundation.
Scheduled report distribution can also make important reporting easier to consume by delivering recurring updates directly to the people who need them.
- Executive-level views
- Branch and regional reporting
- Manager and team performance views
- Individual salesperson performance reporting
- Scheduled report distribution
- Self-service filtering and exploration
Reports should do more than display data
If leadership does not trust the numbers, cannot find the KPIs that matter, or still depends on Excel exports and manual analysis to get answers, Visus can help.
We can evaluate your existing reporting environment, work with your team to understand the decisions the business needs to make, and design reporting that is clearer, more reliable, and more useful.
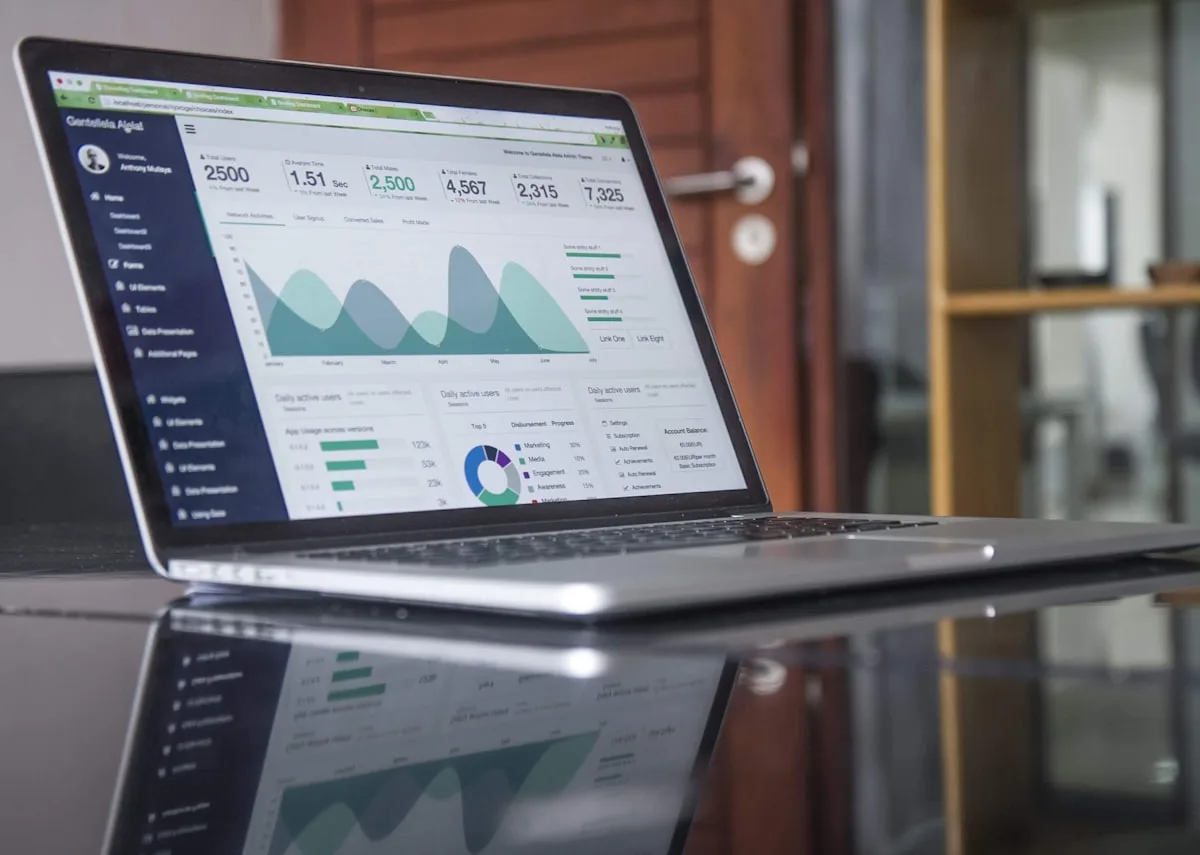
Good visualization can change how quickly people understand the business
For a national company with branches across the country and a large sales organization, Visus built Power BI reporting designed around how leaders and teams actually use the data.
One report uses a map to show branches and customers geographically, with each customer represented visually based on revenue size. Larger revenue-producing customers appear more prominently, making it easier for users to quickly understand where the largest accounts are concentrated and which smaller accounts may represent opportunities for growth.
Rather than forcing users to interpret rows of data, the visualization helps branch and sales leaders see the business spatially and identify where attention may be needed.
The same reporting environment also gives different audiences the information relevant to their roles:
- Leadership can monitor overall business performance and health
- Branch and sales leaders can compare performance across locations and accounts
- Individual salespeople can see progress toward goals, rankings, and expected commissions
That is the difference between showing data and designing reporting around decisions.
Reporting is only useful when people believe it
In the same national-company engagement, some existing Power BI reports contained incorrect business logic and calculations. The reporting did not always reflect how the organization actually measured performance, creating doubt among the people who relied on it.
Visus worked directly with department leaders to understand how important calculations should work and then corrected the logic in the reporting environment.
That collaboration is essential.
The reporting developer should not guess how the business defines success. The people who manage the business need to help establish the rules behind the metrics, and the reporting environment should implement those rules consistently.
The result is reporting that better reflects the true story of the business and gives users greater confidence in the decisions they make from it.

The difference should be visible to the business
Reporting that gets in the way
- Conflicting numbers across reports
- Leadership missing important KPIs
- Incorrect calculations or measures
- Users exporting data to Excel for answers
- Cluttered or hard-to-use dashboards
- Slow reports
- Overly complex models
- Different definitions for the same metric
- Multiple overlapping reports
- Users questioning whether the data is correct
Reporting people trust and use
- Trusted calculations and business logic
- Clear executive dashboards and KPI scorecards
- Role-based reporting for different audiences
- Easier self-service analysis
- Faster, more usable reports
- Clearer visual storytelling
- Consistent KPI definitions
- Fewer redundant reports
- Scheduled reporting where appropriate
- Greater confidence in the numbers
Start with the decisions,
not the charts
The best reporting solutions begin with understanding how the business is managed. Visus works with business and technology stakeholders to identify the questions people need answered, the KPIs that matter, the logic behind those KPIs, and the actions the reporting should support.
Understand What People Need to Know
We begin by talking with the people who use the reporting. What decisions are they making? Which metrics matter? Where are they currently struggling? Which reports are trusted, and which are not? This helps define the reporting experience around real business needs instead of simply reproducing existing spreadsheets or dashboards.
Turn Business Requirements Into Useful Reporting
Visus builds new reports or redesigns existing ones, creates or corrects the required calculations and measures, and validates the results with the people who understand the business. Where reporting environments have grown organically, we can also consolidate redundant reports and simplify the user experience.
Keep Reporting Aligned With the Business
Reporting needs change as the business changes. Visus can continue supporting and enhancing the reporting environment as new KPIs are introduced, sales territories change, products are added, organizational priorities evolve, or new data becomes available. We also help optimize slow reports and complex models so the reporting remains usable as adoption grows.
Our primary platform
for modern business intelligence
Power BI is Visus's primary reporting platform because it combines interactive dashboards, strong visualization capabilities, role-based reporting, self-service analysis, scheduled distribution, and close integration with the broader Microsoft data ecosystem.
For organizations using Microsoft technologies, Power BI can work naturally with modern data platforms such as Microsoft Fabric and other enterprise data sources.
Power BI can support:
- Interactive executive dashboards
- KPI scorecards
- Department and team reporting
- Self-service filtering and analysis
- Scheduled report distribution
- Paginated, print-ready reporting
- Scalable reporting built on centralized data foundations
Visus can also support other enterprise reporting platforms when they are already established in a client's environment, but Power BI remains our primary focus for new business intelligence and reporting solutions.

We solve the reporting problem at the right layer
Visus does more than build dashboards. We understand the data foundation, the warehouse, the business rules behind the metrics, the models, the queries, and how leaders actually use reporting to make decisions.
That means we can identify whether a reporting problem is truly in the report, or whether the issue exists deeper in the data, logic, or architecture underneath it.
Visus brings together years of Data & Analytics experience with expertise across Microsoft Fabric, Power BI, Azure, and AI. As a Microsoft Solutions Partner with designations spanning Data & AI (Azure), Digital & App Innovation (Azure), and Infrastructure (Azure), Visus can help organizations connect reporting to the broader data and technology strategy instead of treating dashboards as an isolated layer.
Better reporting helps people
make better decisions
Greater Confidence in the Numbers
Build reporting on correct calculations, consistent definitions, and trusted data so users spend less time questioning the results.
Faster Decision-Making
Make important KPIs, trends, and performance gaps easier to understand without waiting for custom analysis.
Better Business Visibility
Give executives, managers, branch leaders, and teams role-based views of the performance that matters to them.
More Actionable Reporting
Design reports that help users identify trends, exceptions, opportunities, and areas that need attention.
Client success stories
Business Intelligence
Visus built Chumash Casino Resort a metadata-driven data warehouse and ETL foundation the resort fully owns, extending business intelligence across every area of the enterprise.
View Success Story →Reporting and Performance Management Application - RPM.net
Visus replaced a complex, packaged performance management system with a custom .NET application, making it faster and easier for Santa Barbara County staff to track KPIs and build the Budget Book.
View Success Story →Business Intelligence
Visus helped Deckers Outdoor Corporation unify data from its Sanuk acquisition into a single business intelligence environment, giving hundreds of users a consistent, real-time view of sales performance.
View Success Story →


Build reporting people
trust and use
Bring us the reports people question, the dashboards they avoid, the KPIs leadership cannot see clearly, or the business questions that still require too much manual effort to answer. Visus can help determine whether the issue is the report, the business logic, the data model, or the data foundation underneath it, and build the right solution.
Let's Talk